
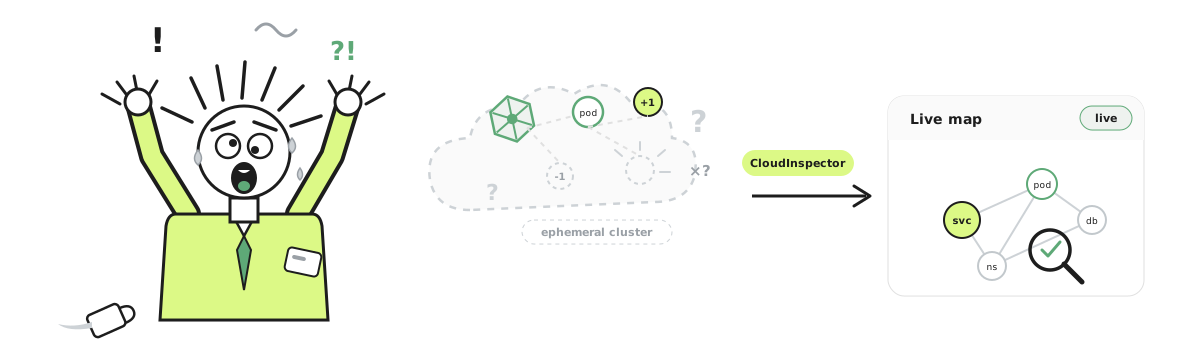
If you manage IT operations for a Kubernetes landscape, you already know the strange position the job puts you in. You are accountable for uptime, change safety, cost, and audit readiness across clusters you do not personally operate. The people who do operate them, your platform engineers, each hold a piece of the picture in their heads and in their terminals. You hold the responsibility for the whole thing.
That gap between what you answer for and what you can actually see is the real problem. It is not a missing dashboard. It is the quiet disappearance of something operations work used to rely on: a stable, knowable inventory of what exists and what changed.
Why Kubernetes broke the old toolkit
The classic operations model assumed infrastructure moved slowly. A server got racked, ticketed, approved, documented. The CMDB stayed roughly current because humans updated it at roughly the pace things changed.
Kubernetes does not move at that pace. A single deployment touches dozens of resources in under a minute. Autoscalers create and destroy pods continuously. CI/CD pipelines bypass every manual step by design. The records you are supposed to rely on, the asset inventory, the change log, the “just ask the team” reflex, go stale almost by default. The clusters even fail in ways no one wrote a runbook for, as the long catalogue of Kubernetes failure stories and posts like SUSE’s Kubernetes clusters break in the weirdest ways make painfully clear.
So the manager is left answering for an environment they cannot reliably observe. Below are five questions you should be able to answer in one click. Each one is a daily struggle that real practitioners describe out loud, and each one is mostly a data problem: getting an accurate, current picture of your infrastructure without anyone maintaining it by hand.
Question 1: What is actually running across our clusters?
This sounds like it should be trivial. It is not. On r/kubernetes, an engineer described their company trying to inventory everything across several datacenters and simply not being able to answer where their own pods were running. That is the normal state of affairs, not an outlier.
Manual inventory loses this race at any real scale, because resources are born from pipelines and operators that never tell your configuration database they exist. What you need is a CMDB that updates itself: continuous, automated cloud inventory management that reflects reality instead of last quarter’s wiki page.
CloudInspector scrapes your clusters continuously and builds a live map of every resource and every relationship between resources. Because it is built as a multi-cluster Kubernetes monitoring solution, you get one picture of the whole estate instead of a blind spot per cluster. CloudInspector’s Asset Inventory Map is a searchable, exportable record of what exists, and it gives you a real Kubernetes cluster overview dashboard that you can read without opening a terminal. Nothing has to be entered by hand. When a Deployment appears, it appears on the map. When a pod dies, it gets an end timestamp.
Question 2: Which version is actually in production?
Staging and production are supposed to match. Often they do not, and proving it can eat up an afternoon. When the r/kubernetes community was asked to name their number one daily struggle, “stopping configuration drift” sat right at the top of the list, next to RBAC and cost. Drift is not a rare event you respond to. It is a standing condition you live with, and the wider industry has written plenty about how Kubernetes configuration drift happens and why it is so hard to stop.
The fix is to make version states comparable instead of reconstructed. CloudInspector’s Version Matrix shows you the current version of each component by environment, with previous versions and their timestamps, so a release manager can see at a glance where each version lives. Where and when staging has moved ahead of production, or a cluster is a release behind, the drift is highlighted rather than hidden.
Question 3: What changed, and what depends on what?
When something breaks, most of the lost time goes to two questions: what changed just before this started, and what does the broken thing actually depend on. Until you answer them, you are doing archaeology while on the clock.
The cost of not answering them quickly is not subtle. In one r/sre thread on incident handling, an engineer recalled a minor incident where communication spun so far out of control that the actual CEO was calling SREs on their cellphones. That is what triage without visibility escalates into.
This is the heart of a proper Kubernetes incident analysis platform, and the most direct way to reduce MTTR on Kubernetes incidents. CloudInspector’s Incident Analysis uses a time range filter: scope the cluster state to the minutes around the outage and get the infrastructure changes in that window, filtered to service-level events instead of pod noise. From there, Blast Radius shows you what sits downstream of the failing component, so a deployment blast radius analysis takes seconds instead of a whiteboard session. To be clear about what this is: it maps structural dependencies, the ownership and Kubernetes relationships between resources, not live network traffic. That distinction matters, and it is usually enough to point the investigation in the right direction.
Question 4: Who owns this, and what is orphaned?
You cannot page a resource. You page a person. And in practice, ownership rots. Labels get dropped during refactors, test namespaces never get cleaned up, and nobody notices a resource has gone orphan until it matters. One r/devops veteran put the cultural root of it bluntly, saying they had met exactly zero developers who showed even a marginal interest in how their code was packaged, versioned, and deployed. The result is the common problem of orphaned resources piling up quietly in every cluster.
CloudInspector’s Ownership Overview rolls ownership up across the estate and propagates it through the map, so a pod without its own owner annotation inherits from its parent. You get a clear answer to “who do I call.” And Shadow IT Detection turns the inverse into a list: resources missing required labels, pods without a parent, anything with no owner at all. Shadow IT detection like this is far more practical than running kubectl get all -A across every cluster and sorting the output by hand.
Question 5: Can I answer audit and security questions without becoming the bottleneck?
Every time an auditor, a security officer, or a board member asks a question, the answer tends to live in someone’s terminal, and that someone is often you. The questions are predictable. What existed on this date? Who can touch this resource? The governance pressure behind them is real, and it is why so many teams end up building tools just to keep control of resources created and used by engineering teams at scale. The access half is no easier, as anyone who has tried to reason about whether their RBAC setup even scales can tell you.
CloudInspector makes this self-serve. The Point-in-Time Export reconstructs the state of your infrastructure as of any timestamp and hands it back as CSV, JSON, or PDF, exactly the Kubernetes audit export and compliance documentation an auditor asks for. Authorization Visibility lays out who can do what with which resources, so the access question has a picture instead of a guess. The evidence is verifiable, and you are no longer the human API for it.
What CloudInspector does not do
A blog post that only lists wins is not worth your trust, so here is the honest boundary.
It is Kubernetes-focused today. Discovery for AWS, Azure, and GCP is on the roadmap, not in your hands yet. If your world is mostly Kubernetes, that is fine. If cross-cloud asset coverage is the main thing you need, know that going in.
It maps structural dependencies, not live network traffic. Blast radius is built from ownership and Kubernetes relationships. Seeing which service actually calls which at runtime needs network-level observation, and that only works on newer clusters.
And it is not a replacement for your ITSM or your metrics stack. It does not run approval workflows like ServiceNow or your ticketing system, and it does not replace Prometheus or Grafana for time-series metrics. CloudInspector is a discovery and history layer. It knows what is running, how it is connected, and what changed. It sits underneath those tools and feeds them, in the same way an accurate CMDB sits underneath ITIL asset management.
The shape of the fix
Notice the through line in all five questions. None of them is really about charts or alerts. Each is about having an accurate, current, historical picture of your infrastructure, and being able to read it at the altitude your job actually operates at.
That is the bet CloudInspector makes. Scrape the clusters continuously, build one live map with full history, and let the operations manager work in overview, dropping into detail only when a question demands it. The inventory stays current because no human has to maintain it. The history is there because it was recorded as it happened, not reconstructed under pressure at two in the morning.
Your job is to be accountable for the environment. The tooling should at least let you see it.
You can point CloudInspector at a single cluster and have this map in front of you the same afternoon. Start at cloudinspector.app.
Does this sound helpful? Something missing? Don’t hesitate to contact us. We would love to hear from you!
