
Anyone who has operated Kubernetes at scale knows the feeling.
At first, the platform provides exactly what you need. You can inspect deployments, services, namespaces, pods, and workloads. Observability tools give you metrics, logs, and traces. Everything seems transparent.
Then the first governance-related questions appear:
Which business applications are actually running right now?
Which team owns this service?
What infrastructure belonged to Release 24.3?
And perhaps the most difficult question:
What did the landscape look like three weeks ago?
Suddenly, technical visibility is no longer enough.
Kubernetes understands resources. Businesses think in applications, products, teams, and capabilities. This is where business service mapping becomes essential and where most tooling stops short.
Bridging this gap became the starting point of our architecture.
A First Approach: Infrastructure Snapshots
The kubernetes API allows good visibility ito the cluster state, so the first and logical approach would be to simply periodically scan infrastructure and build inventories from that data.
Conceptually, the architecture looks like this:
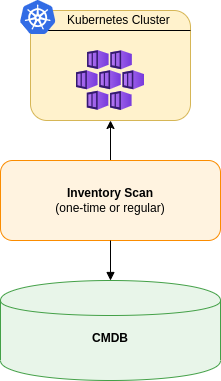
This works reasonably well for static environments, and many governance solutions and monitoring tools have implemented this approach.
But the challenge appears when infrastructure becomes highly dynamic, because modern Kubernetes platforms may process thousands of changes per day:
- Deployments created
- Services modified
- Labels updated
- Resources removed
- New clusters added
A periodic inventory can tell you what exists now, but it struggles to explain how the environment evolved.
Thinking in Events Instead of States
Our first architectural decision was therefore simple:
Infrastructure is not a collection of objects.
Infrastructure is a stream of events.
Instead of taking snapshots every few hours, we continuously observe changes as they happen.
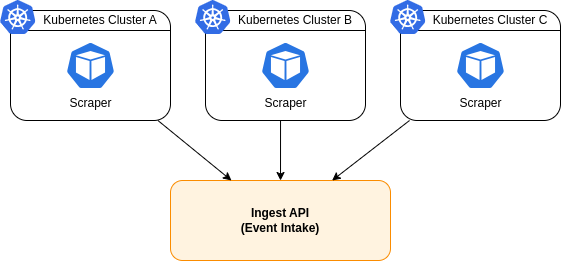
Every connected cluster runs a lightweight scraper component, its only task is to watch the Kubernetes API and emit events whenever something changes.
Deployment Created
Deployment Updated
Service Deleted
Label Changed
Config Updated
...
Those events are forwarded to the central platform.
Multi-Cluster by Design
The platform was never intended for a single Kubernetes cluster.
Most enterprise environments operate dozens, or even hundreds, of clusters across different regions, clouds, and business units. Effective multi cluster management therefore had to be a foundational property, not an afterthought.
For that reason, every cluster contributes independently to a shared event platform.
The architecture scales horizontally with the customer’s platform landscape.
No central component needs direct access to all clusters.
Event Sourcing as the Foundation
One of the most important design principles is that the ingestion layer does not interpret incoming data, it simply stores events.
Rather than storing only the current state, the platform stores the entire history of change.
Event 1  ---> Deployment Created
Event 2  ---> Service Added
Event 3  ---> Deployment Updated
Event 4  ---> Config Changed
Event 5  ---> Service Removed
The current state becomes merely a projection of historical events.
This enables capabilities that are difficult to achieve with traditional inventory systems:
✅ Full auditability
✅ Historical reconstruction
✅ Release comparison
✅ Change tracking
✅ Time travel
Building a Business-Oriented Domain Model for the Cloud
Raw Kubernetes resources are rarely useful for decision makers, nobody wants to discuss ConfigMaps and ReplicaSets during an architecture review.
What people actually care about are applications and business services.
The processor layer therefore transforms technical resources into higher-level domain entities, turning low-level objects into meaningful business service mapping.
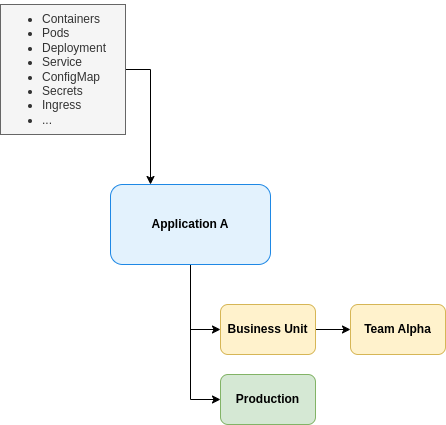
This creates a business-centric view of the platform landscape without losing the underlying technical traceability. The result also doubles as a living Kubernetes cluster architecture documentation tool. Your architecture diagram is never out of date, because it is derived directly from the running system.
A Kubernetes Dependency Graph That Reflects Reality
Once events are projected into a domain model, the relationships between resources become first-class data.
CloudInspector renders this as a Kubernetes service dependency graph: which workloads talk to which services, which services are exposed externally, and how applications connect across namespaces and clusters.
Because the graph is reconstructed from recorded events rather than hand-drawn, it always reflects the actual state of the cluster. This makes Kubernetes deployment blast radius analysis straightforward: before shipping a change, teams can see exactly which downstream services and applications depend on the component being modified.
Time Travel for Cloud and Kubernetes Infrastructure
The most interesting side effect of event sourcing is that every historical state can be reconstructed.
Instead of asking:
What exists now?
Users can ask:
What existed on March 3rd at 14:32?
The system simply is able to replay events up to that point in time. In practice, this is exposed as a Kubernetes cluster state time range filter. Drag the timeline to any moment and the entire dependency graph re-renders as it was then.
For platform teams, this becomes incredibly valuable during:
- Incident investigations
- Security audits
- Release analysis
- Compliance reporting
Designed for Complete Data Sovereignty
A requirement from the beginning was that the platform must not depend on external services.
Many governance and observability products eventually push metadata into a vendor-controlled SaaS platform.
We intentionally chose a different path: a Kubernetes observability platform on-premises, where every component runs within the customer’s environment.
No infrastructure metadata leaves the customer’s security boundary, no SaaS dependencies are required, no external API calls are necessary.
Even the optional AI assistant can run entirely on locally hosted models.
For regulated industries and security-sensitive environments, this architectural choice is often more important than any individual feature.
A Natural Language Interface on Top of Structured Data
One misconception about AI in infrastructure tooling is that the language model somehow understands the environment directly.
In our architecture, the opposite is true.
The heavy lifting is done by the platform itself:
- The processor creates a structured and deterministic domain model.
- The LLM merely provides a natural language interface to that model.
This significantly improves reliability while maintaining explainability and auditability.
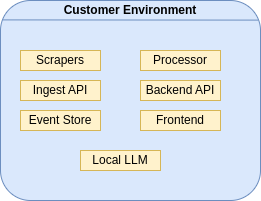
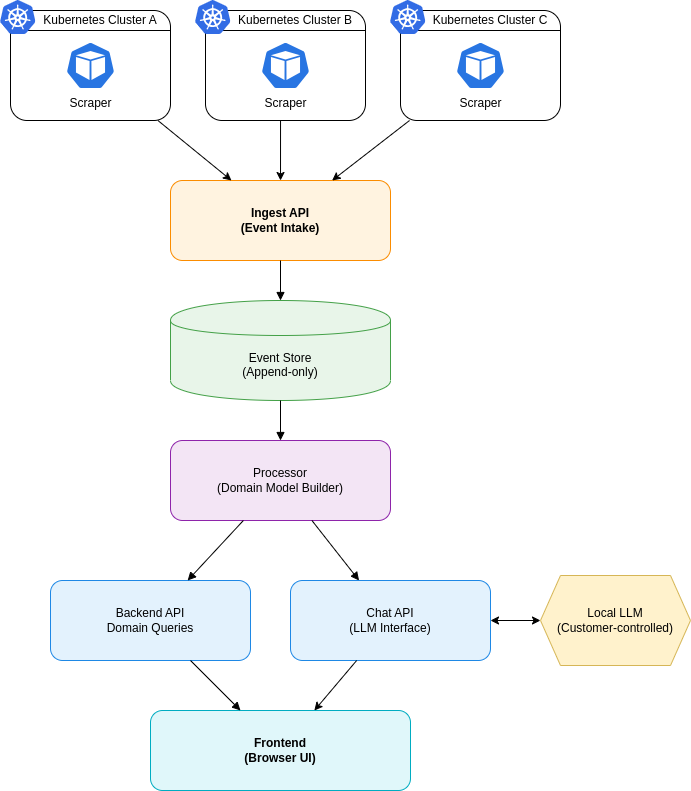
System Architecture Overview
Having previously introduced the individual building blocks, we now bring everything together into a unified view of the system. The following diagram illustrates how these components interact end-to-end within the customers environment, forming a coherent pipeline from data collection to visualization:
Why Not Simply Read the GitOps State?
A common question is why we do not simply integrate with existing GitOps or Infrastructure-as-Code tooling.
The answer is simple: Git describes the desired state. We are interested in the actual state.
Git repositories, Helm charts, and Terraform configurations define how the platform is supposed to look. Once deployed, however, Kubernetes becomes a highly dynamic system. Deployments create ReplicaSets, ReplicaSets create Pods, autoscalers adjust replica counts, workloads are rescheduled, and self-healing mechanisms continuously react to failures.
As a result, the runtime state of a cluster quickly diverges from the static configuration that originally created it.
There is also a practical consideration: not every change necessarily goes through the GitOps pipeline. Administrators or authorized engineers may perform emergency fixes, operational changes, or troubleshooting activities directly in the cluster.
For governance, auditing, and historical reconstruction, those changes are just as important as pipeline-driven deployments.
This is why the platform observes the Kubernetes API directly. Instead of tracking what should happen, it records what actually happens. Only the live cluster can provide the complete and authoritative view of the infrastructure landscape.
Closing Thoughts
Kubernetes provides an excellent runtime platform.
What it does not provide is a historical and business-oriented understanding of the systems running on top of it.
By combining event sourcing, domain-driven modeling, historical reconstruction, and complete deployment independence, we are building something different from another dashboard or inventory tool.
We are building a system that allows organizations to understand not only what their infrastructure is, but also how it became what it is today.
In other words:
We are not building a Kubernetes dashboard.
We are building a time machine for cloud infrastructure.
You can check out the use cases page and learn why Release Managers, CTOs & Technical Leadership, IT Change Managers, IT Governance & Security as well as Platform Owners will benefit from CloudInspector.
Let us know if there a questions or thoughts about the architecture! We are available to chat: contact@cloudinspector.app.
CloudInspector is made with ❤ in Berlin.
